Medium to large retailers gaining market share at the expense of on-demand express delivery services
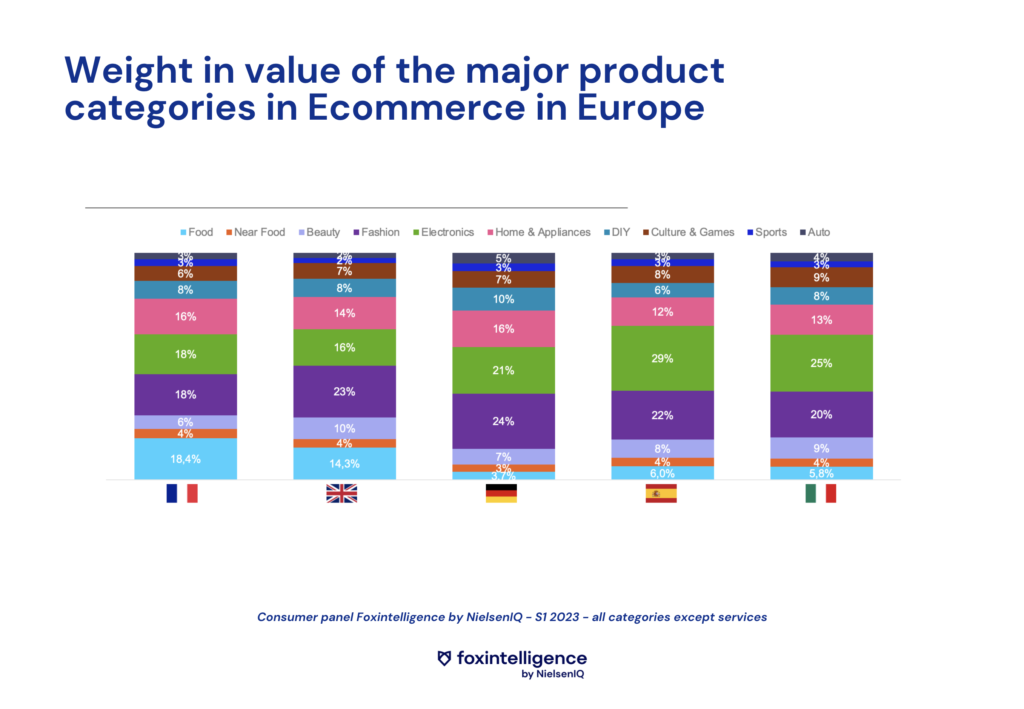
On the Foxintelligence platform, it is possible to break down sales by category, by type of retailer, and even by brand in order to analyze the weight of the various market players.
In the first half of 2023, medium-sized and large retailers accounted for the bulk of online food sales. These players are on the rise, and have gained market share compared to the first half of 2022. This market share has been gained at the expense of generalist pure players who specialize in food and have no physical stores – but also at the expense of quick commerce.
The trend is reversing for the beauty category: supermarkets are losing market share, to the benefit of generalist pure players and DtoC brands.
This observation is justified by the presence of numerous players on the market.
Generalists (Amazon), beauty specialists (Sephora), direct-to-consumer; depending on the product category, the typology of players varies widely. That’s why it’s essential to have as complete a picture as possible of what’s going on: a holistic view enables you to position yourself, to know who your competitors are in Ecommerce – bearing in mind that competitors can be very different on the offline market.
Variations in the beauty category are significant: beauty specialists lost 4 points of market share compared to last year – while generalist pure players gained 2.5 points.
Fashion category: behavior varies widely by customer segment
Consumer behavior varies widely by customer segment.
On the Foxintelligence platform, by segmenting the different consumers – we obtain a precise and detailed vision of their purchasing behavior.
→ You can also do the same thing from a demographic point of view, by interests, age…
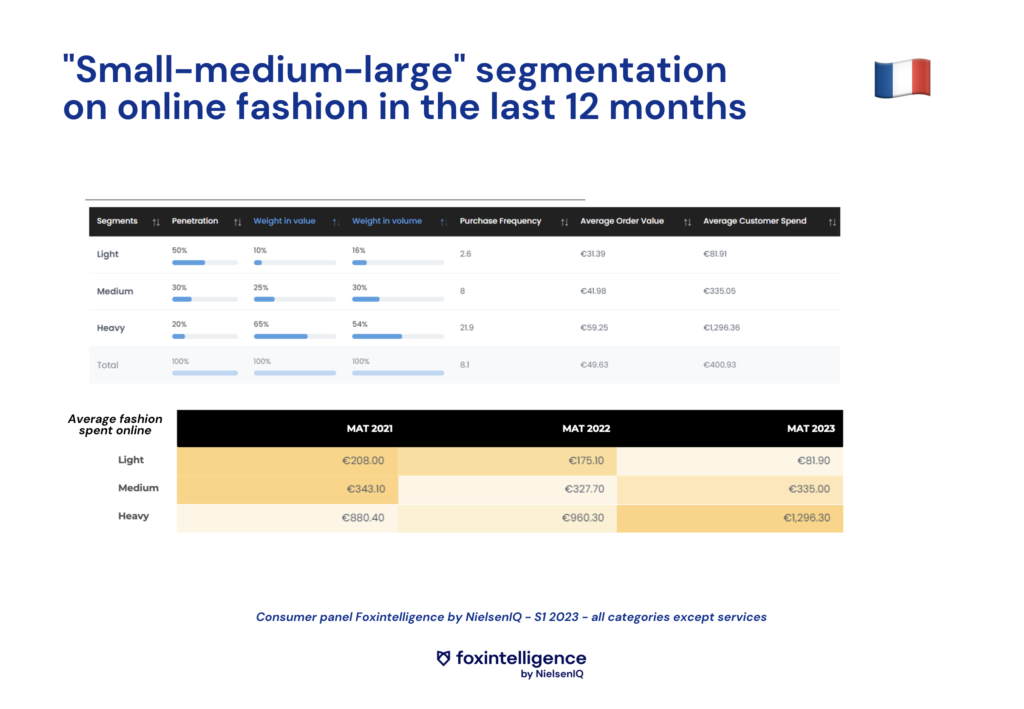
If we look at the last 12 months, and break down fashion buyers into the following categories:
- Heavy shoppers: These are the 20% of buyers who spend the most on fashion online. These 20% of buyers actually account for 65% of purchases by value. Over 12 months, they will make an average of 22 purchases, or almost 2 purchases per month. With an average basket value of €60, they spend a total of €1,300 a year online in the fashion category alone.
- Light shoppers: These are 50% of fashion buyers. Their average expenditure over the year is less than €90 – the amount and frequency of purchase are much lower than for heavy shoppers.
As a brand or retailer, it’s important to be aware of these different online behaviors. Foxintelligence data can help you define:
- Who are these major fashion players?
- Which newsletters are the most popular?
- Which websites do they visit?
- What types of products do they buy?
We can see that the big buyers have increased their online fashion budget from year to year: nearly €400 in 2 years. For industry players, it’s a competitive advantage to have access to such data, to be able to identify this cohort of customers, especially in a period of consumer recession. These insights enable us to identify priority customer segments on which to focus.
Conversely, if we look in more detail at the light shoppers segment, we notice that they had higher online spending in previous years. This begs the question:
- Have they stopped buying fashion?
- Or have they stopped buying fashion online?
These are the kinds of questions that the Foxintelligence platform can help investigate.
Second-hand, a fundamental trend
It’s nothing new: the second-hand and refurbished market (particularly for electronic products) is a real underlying trend.
Here, we examine the weight of the top 3 platforms in France specializing in second-hand products (Vinted, Back Market and Le Bon Coin) in the overall Ecommerce market, all categories combined – and the half-year evolution of their relative weight and market share in Ecommerce as a whole.
The power of marketplace sales in Ecommerce
There are several types of players:
- Players with a pure marketplace model, such as Rakuten
- Players with a hybrid model, such as Darty, which has both an Ecommerce site and a marketplace.
But from the consumer’s point of view, what counts is having access to the right product, at the right price, and having it delivered on time.
Looking at the market figures over the last 12 months, we can see that buyers have made both 1P purchases (first party, classic retailer model) and marketplace purchases. These are the same consumers, who just want to be able to buy the product they’re looking for. There’s a real complementarity between 1P and 3P (third party).
We can also see that the weight of the marketplace varies greatly according to product category.
It is in the DIY category that the weight of the marketplace is greatest. In the first half of the year, across all sectors in France, 42% of online DIY sales were made via the marketplace model. This figure is slightly down on last year (43%), but DIY remains the leading category in terms of value.
Conversely, the weight of marketplace sales in the food sector is much lower, currently only 4%.